Channel chart-patterns
Channel patterns are technical analysis chart formations where the price moves between two parallel trendlines, representing support and resistance levels. These channels can be ascending, descending, or horizontal, and help traders identify potential breakout or reversal points as the price oscillates within the channel boundaries.
Trading Strategies
Ascending Channel
Upword signal
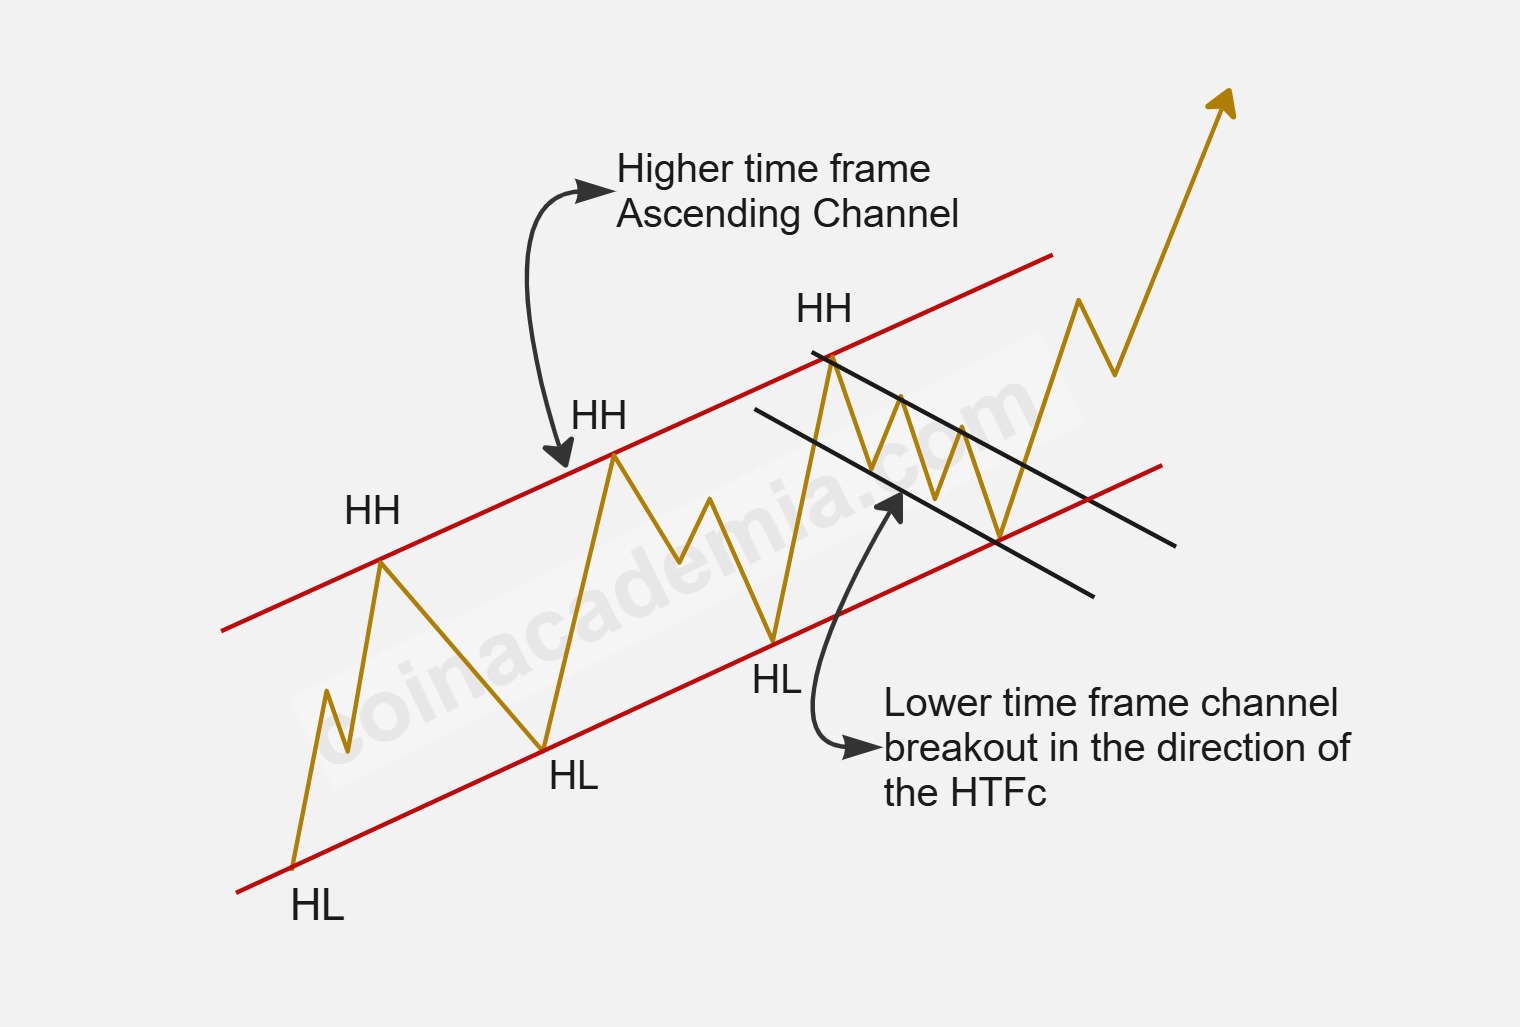
An ascending channel is a bullish chart pattern formed by drawing two parallel trendlines that connect higher highs and higher lows. This pattern indicates a steady upward trend, with price oscillating between support and resistance levels within the channel.
When a breakout occurs on a lower timeframe in the same direction as the higher timeframe channel (upward), it can signal a strong continuation of the prevailing trend. Traders often look for confirmation of the breakout with increased volume or a retest of the channel boundary as support.
Combining analysis of multiple timeframes helps traders identify high-probability trade setups and align entries with the dominant market trend. Proper risk management and confirmation from other indicators are recommended to avoid false breakouts.
Understanding the psychology behind the ascending channel is important for traders. As the price moves within the channel, buyers consistently step in at higher lows, showing strong demand and confidence in the uptrend. Sellers, on the other hand, tend to take profits at the upper boundary, causing temporary pullbacks. This tug-of-war creates a predictable pattern that can be used to plan entries and exits more effectively.
For beginners, practicing the identification of ascending channels on historical charts can be very helpful. By drawing trendlines and observing how price reacts at the boundaries, traders can gain confidence in spotting these patterns in real time. It is also useful to combine channel analysis with other tools, such as moving averages or momentum indicators, to increase the reliability of trade signals and improve overall trading performance.
Ascending Channel - Bearrish signal
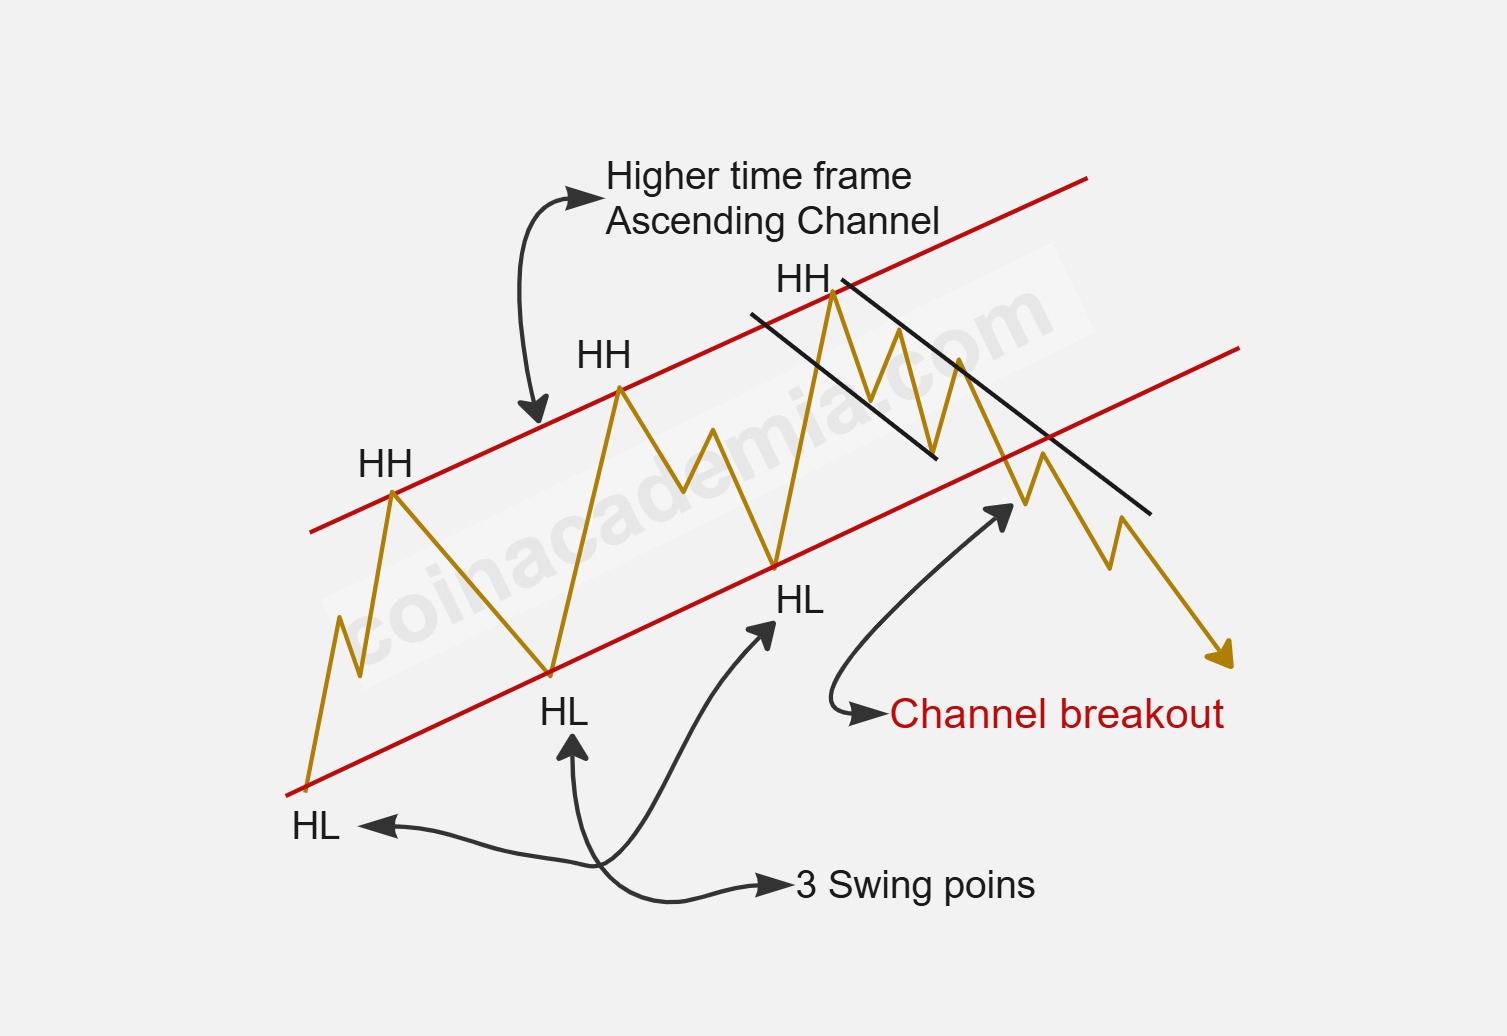
An ascending channel can sometimes result in bearish outcomes, especially when the price breaks down below the lower trendline of the channel. This breakdown signals that the upward momentum is weakening and sellers are gaining control, potentially leading to a trend reversal or a significant pullback.
Bearish results are confirmed when the breakdown is accompanied by increased trading volume, indicating strong selling pressure. Traders often look for confirmation before entering short positions, such as a retest of the broken support as resistance or bearish candlestick patterns.
It's important to manage risk carefully, as false breakouts can occur. Using stop-loss orders above the channel or waiting for additional confirmation can help reduce the risk of losses.
Understanding the potential for bearish outcomes in ascending channels allows traders to prepare for reversals and adjust their strategies accordingly, especially in overextended markets.
Descending Channel Bulish Signal
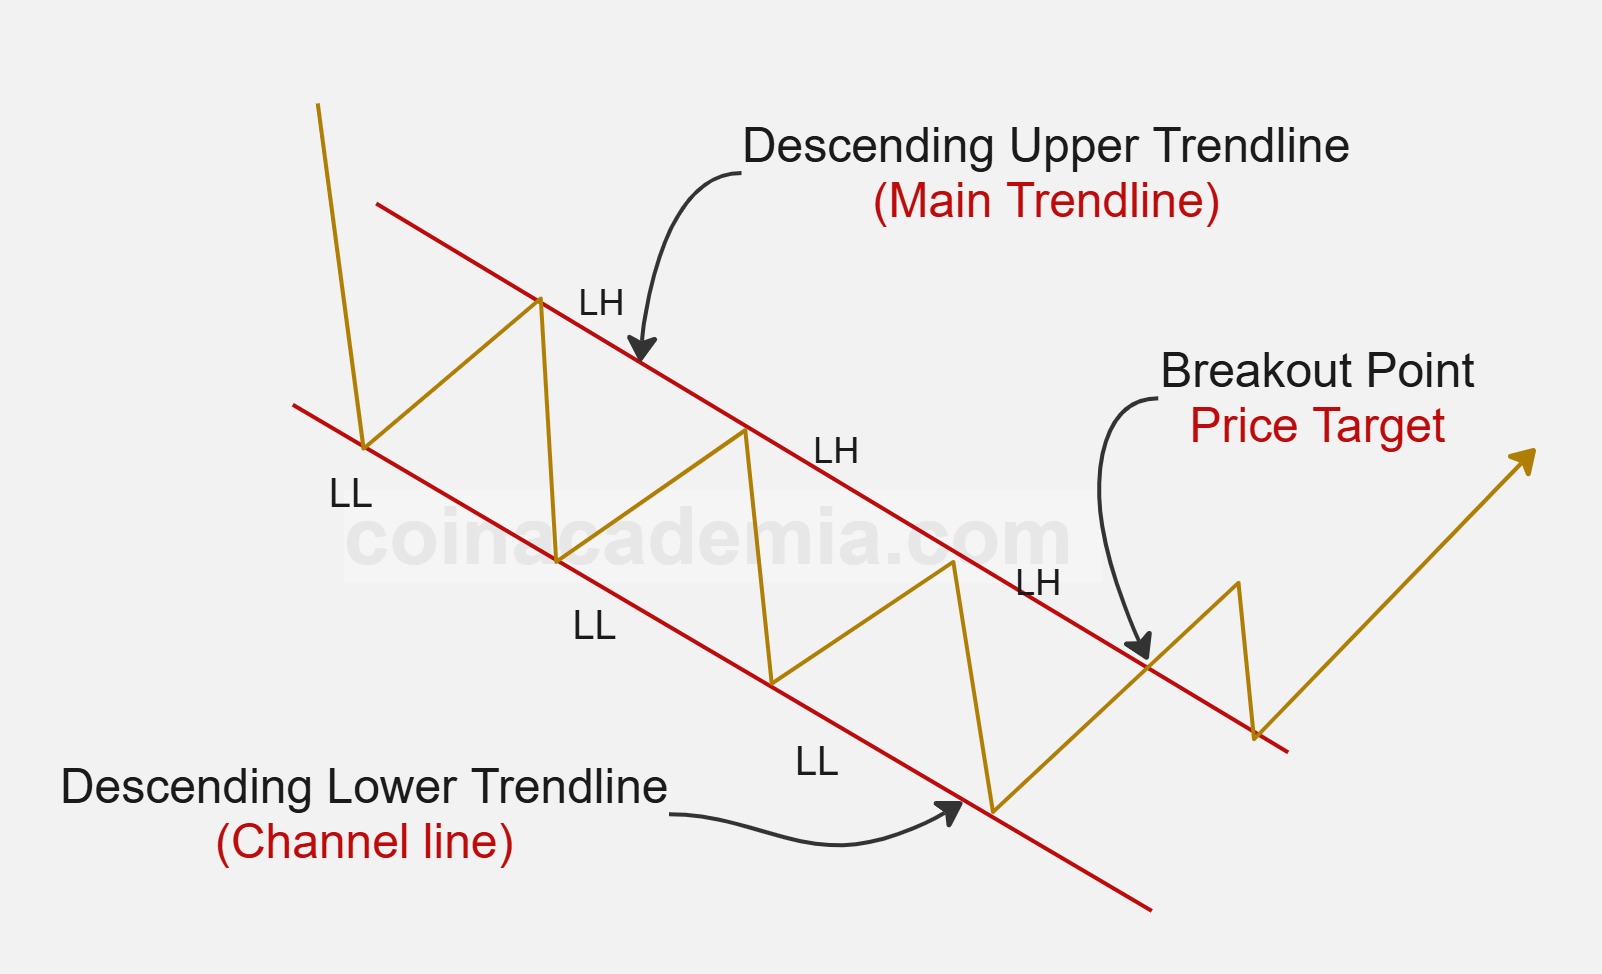
A descending channel is a bearish chart pattern formed by drawing two parallel trendlines that connect lower highs and lower lows. While the overall trend is downward, a breakout above the upper trendline signals a potential bullish reversal. This breakout suggests that buyers are gaining strength and the downtrend may be ending.
Traders often look for confirmation of the breakout with increased volume or a successful retest of the broken trendline as new support. Entering a trade after confirmation can help reduce the risk of false breakouts.
Combining analysis of multiple timeframes helps traders identify high-probability setups. For example, a breakout on a lower timeframe that aligns with bullish signals on a higher timeframe can provide stronger conviction for a trade.
Understanding the psychology behind the descending channel breakout is important. As sellers lose momentum and buyers step in, the price breaks above resistance, often triggering stop-losses for short positions and attracting new buyers. This can accelerate the upward move.
For beginners, practicing the identification of descending channels and breakout scenarios on historical charts is valuable. Using additional indicators, such as moving averages or momentum oscillators, can further improve the reliability of breakout signals and overall trading performance.
Descending Channel - bearish
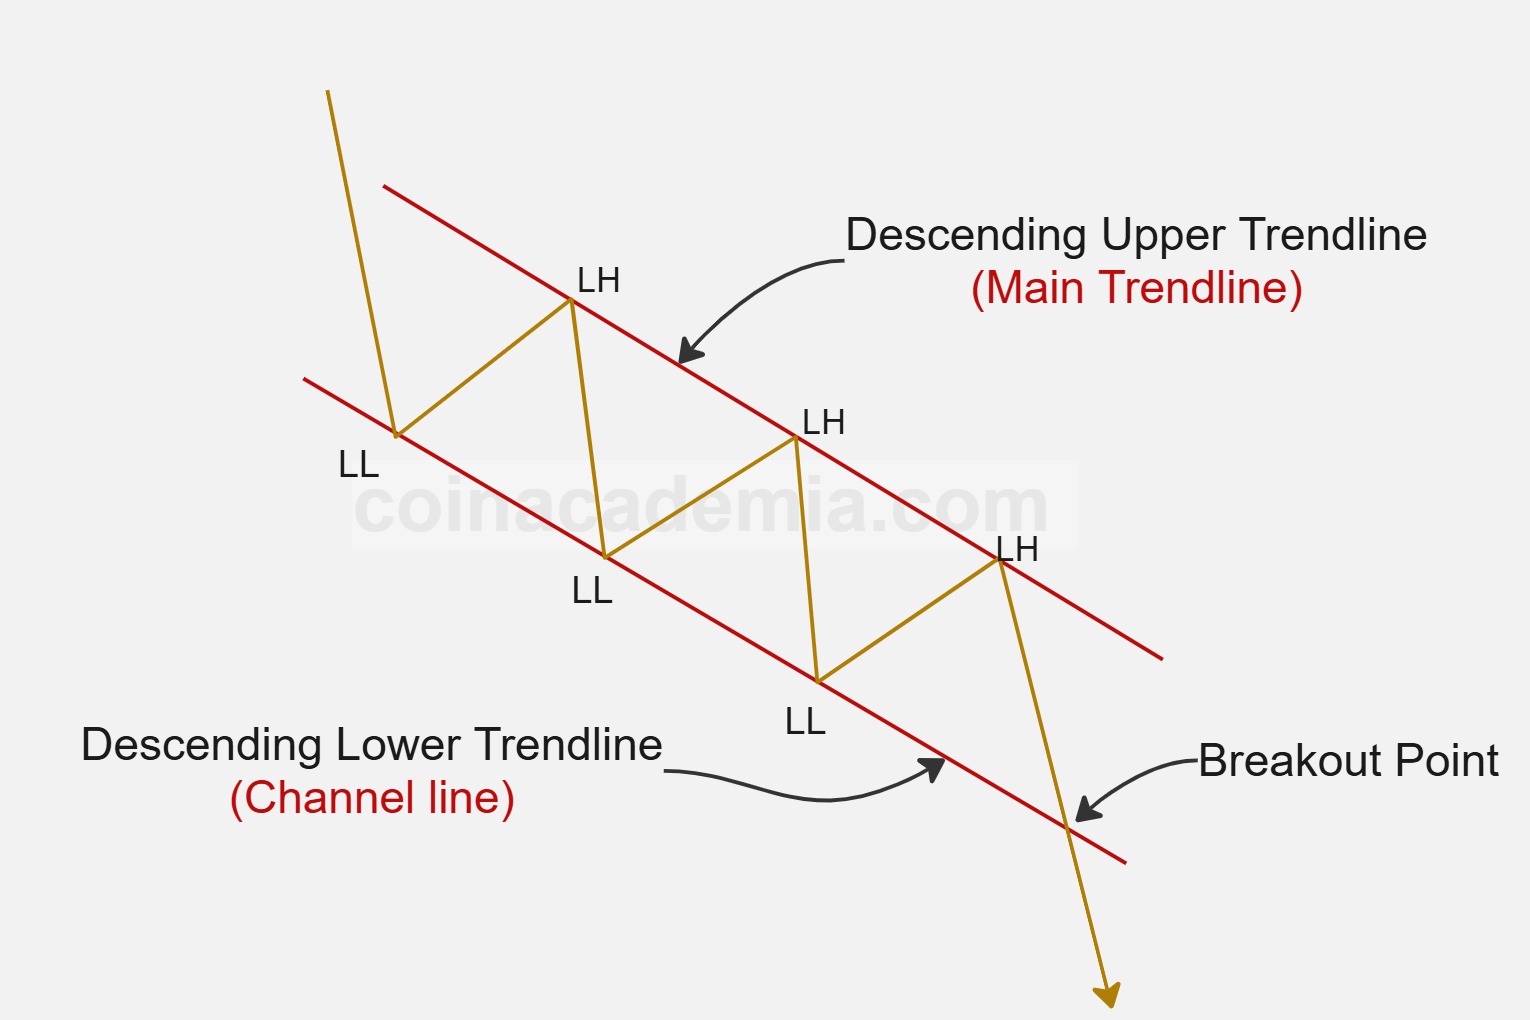
A descending channel pattern can also signal a continuation of a bearish trend. In this scenario, the price remains confined within two downward-sloping parallel trendlines, consistently making lower highs and lower lows. A breakdown below the lower trendline is considered a bearish signal, suggesting that sellers are maintaining control and the downtrend may accelerate.
Traders often look for confirmation of the breakdown with increased volume or a successful retest of the broken support as new resistance. Entering a trade after confirmation can help reduce the risk of false breakdowns.
Risk management is crucial—setting stop-loss orders above the breakdown level or the most recent swing high can help protect against unexpected reversals. Using additional technical indicators, such as moving averages or momentum oscillators, can further validate the bearish signal.
Understanding descending channel breakdowns helps traders align their strategies with prevailing market momentum and capitalize on strong downward moves.
However, traders should be cautious of false breakdowns, where the price briefly moves below the channel but quickly reverses. Analyzing multiple timeframes and waiting for confirmation can help reduce the risk of losses.
Horizontal Channel Pattern Bulish Signal
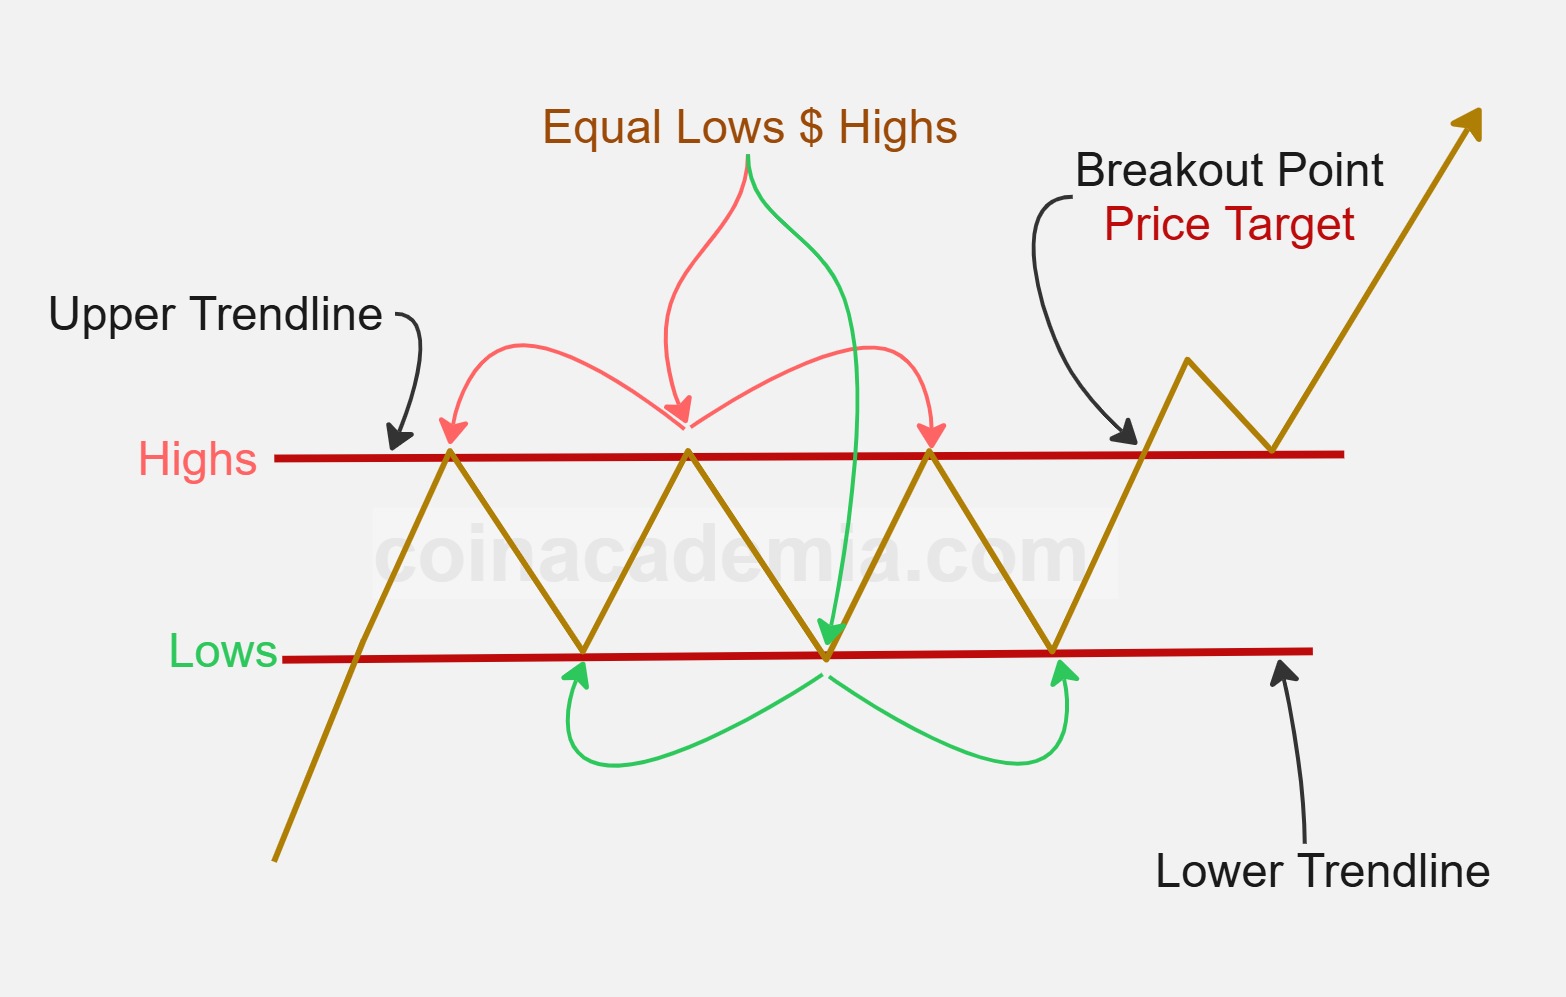
A horizontal channel pattern, also known as a rectangle or range, forms when the price moves between two parallel support and resistance levels. This pattern indicates a period of consolidation where neither buyers nor sellers are in control.
A bullish signal occurs when the price breaks out above the upper resistance line of the channel. This breakout suggests that buyers have gained strength and a new upward trend may begin.
Traders often look for confirmation of the breakout with increased volume or a successful retest of the broken resistance as new support. Entering a trade after confirmation can help reduce the risk of false breakouts.
Combining the horizontal channel breakout with other technical indicators, such as moving averages or momentum oscillators, can improve the reliability of the signal. Practicing the identification of horizontal channels and breakout scenarios on historical charts helps traders build confidence in their strategy.
Understanding the psychology behind the breakout is important: as the price breaks above resistance, short sellers may cover their positions and new buyers may enter, accelerating the upward move.
Horizontal Channel Pattern
bearish
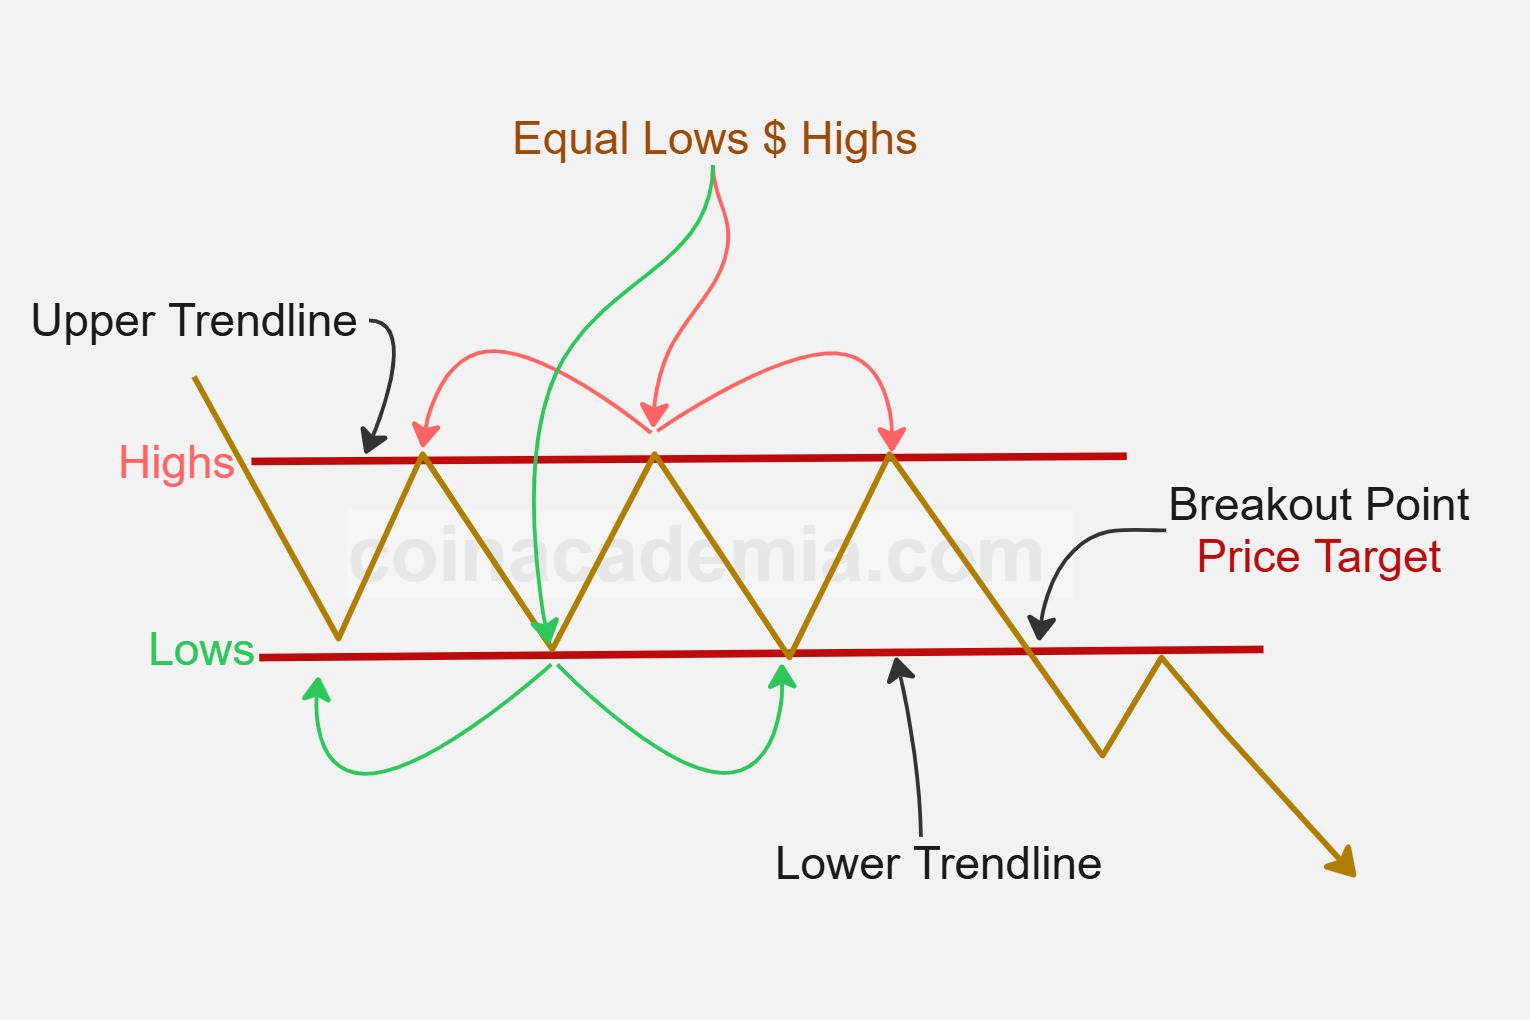
A horizontal channel pattern, also known as a rectangle or range, can also signal a bearish trend when the price breaks below the lower support line of the channel. In this case, the price has been moving sideways between parallel support and resistance levels, indicating a period of consolidation where neither buyers nor sellers dominate.
A bearish signal occurs when the price decisively breaks below the support level, suggesting that sellers have gained control and a new downward trend may begin. This breakdown is often accompanied by increased trading volume, which helps confirm the validity of the move.
Traders typically look for confirmation of the breakdown, such as a retest of the broken support acting as new resistance, before entering a trade. This approach helps reduce the risk of false breakdowns.
Combining the horizontal channel breakdown with other technical indicators, like moving averages or momentum oscillators, can improve the reliability of the bearish signal. Practicing the identification of horizontal channels and breakdown scenarios on historical charts helps traders build confidence in their strategy.
Understanding the psychology behind the breakdown is important: as the price falls below support, stop-loss orders may be triggered and new sellers may enter, accelerating the downward move.
Your Feedback
We value your feedback! Please share your thoughts or questions about this chart pattern. Feel free to leave a comment below, and we'll get back to you as soon as possible.
We appreciate your input and are here to help with any questions you may have.
About Us
Coin Academia is dedicated to providing the best resources for forex and cryptocurrency education and trading.


© 2025 Coin Academia. All rights reserved.